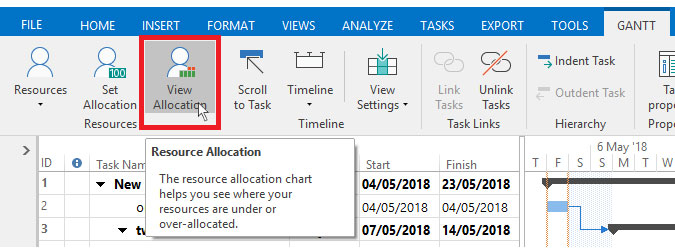
You can analyse resource allocation using the allocation chart, which is available whilst viewing your map as a Gantt chart. To turn on the allocation chart switch to the Gantt ribbon and click Resource Allocation.
The allocation chart shows where your resources are over-allocated, under-allocated or allocated 100%.
For more information on the allocation chart it is recommended to take a few minutes to read the help documentation. To access the help documentation in MindGenius press F1, then use the tree to navigate to User Guide\Using the Gantt View\Analysing Resource Usage.